Instructions
1. Click on "Choose File" to import a PDF floor plan into the drafting panel. Ensure that the plan is prepared in the PDF file so that it extends across the full page width. Overlaying is not generally necessary, you can create whatever plan on the drafting panel.
2. To calibrate the scale, click on the calibration icon (two rulers), measure any known dimension, and insert it into the dialogue box that prompts you, allowing you to redo the calibration until the analysis is completed; we suggest adding a dimension to your PDF drawing in item 1 above and calibrating against it.
3. Now commence tracing the slab edge. Click on the slab icon, and the slab will begin to appear from the first mouse click. Each next mouse click will create segments. To complete the slab, double-click the mouse.
4. Next, draw the walls and cores.
5. Calibrate the scale
6. Capture a screenshot of the drawing and overlay it onto your PDF file using PDF software like Bluebeam.
7. Once clicked on Analyse, the program will ask you to SAVE THE FILE, this is good as you can comeback to your model to open and recheck.
8. Once anlysis completed, click on the loads icon (arrows) to see shears taken by the walls. switch between load view and default view by clicking again on the same icon
Drop us a line at
admin@rkalc.net for feedback
LinkedIn
Verification Example
CentresKALC Verification Example
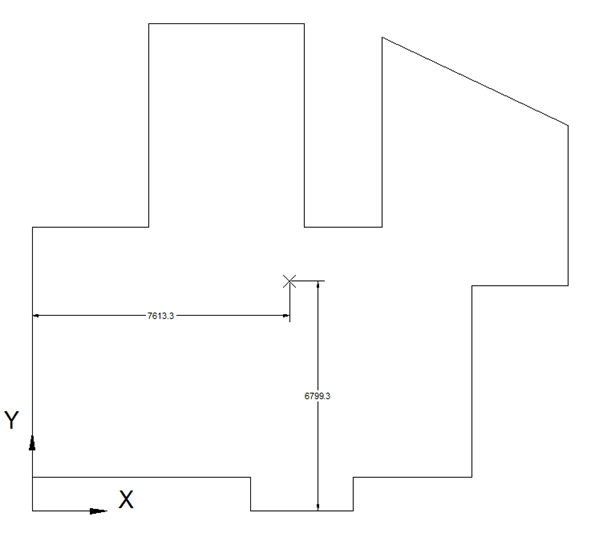
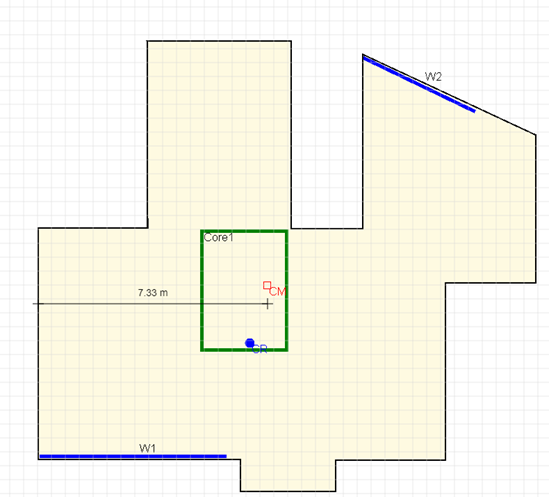
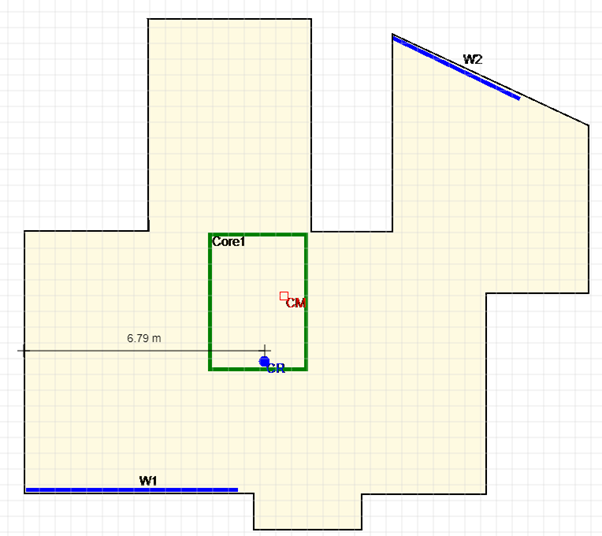
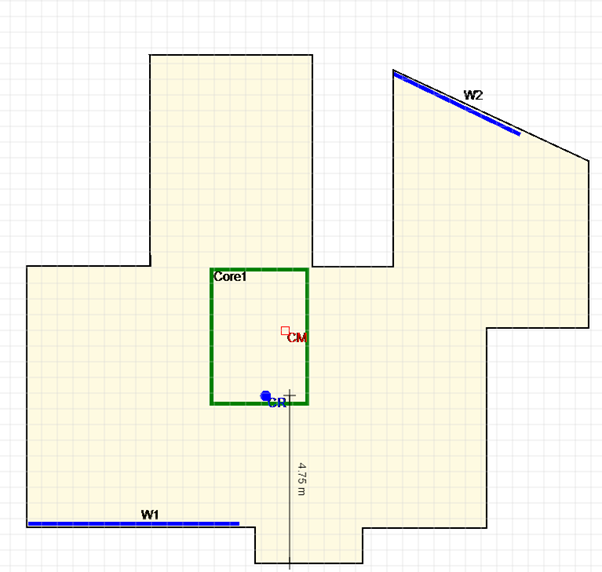
Take the following floor plan
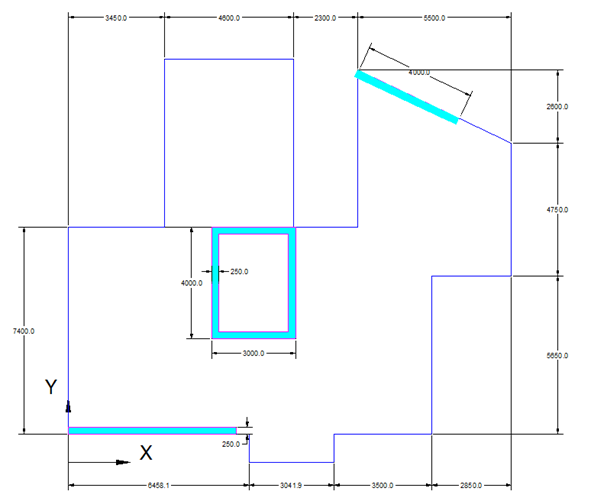
1. Centre of Mass Calculations
1.1. Slab
We will divide the slab to 6 regions as follows
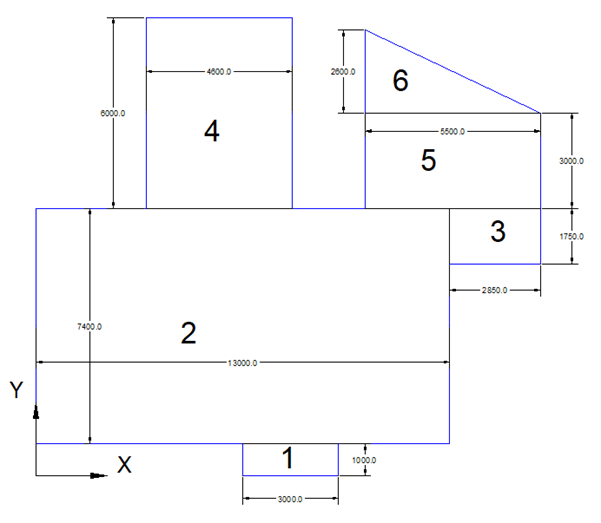
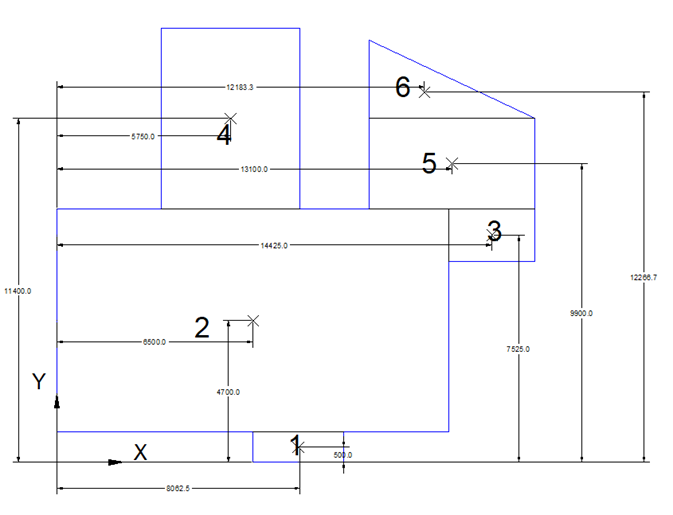
Then calculate the distances X and Y to origin
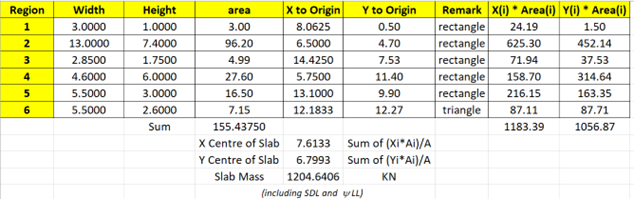
Summarize the results in table as follows, note SDL=1.5 and LL=0.5 (sustained live load)
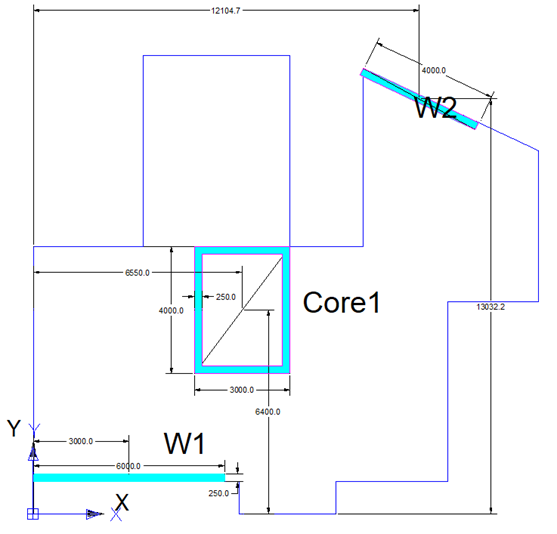
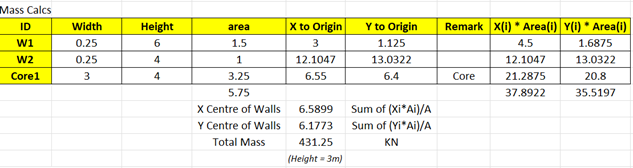
1.2. Walls
Likewise in slabs:
Put things in tables,
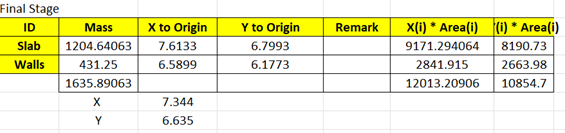
Now for combined walls and slab
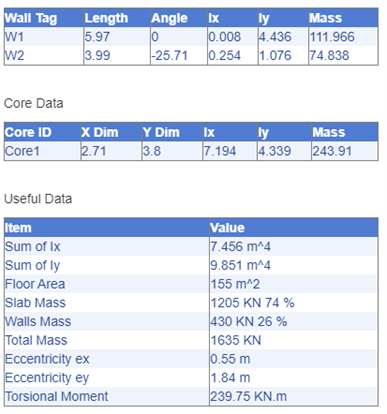
Compare with CentresKALC:
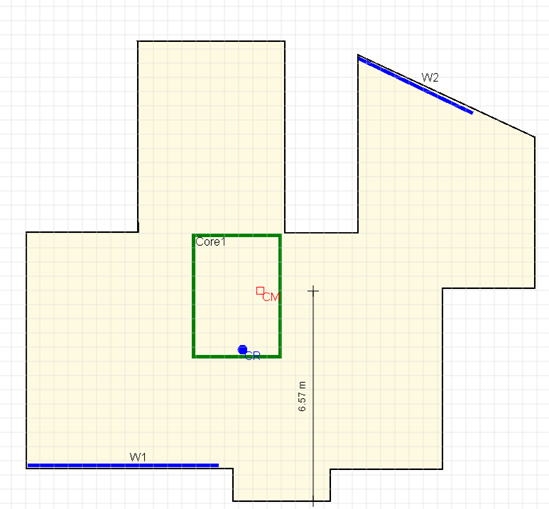
2. Centre of Rigidity Calculations
Like previously done in centre of mass:
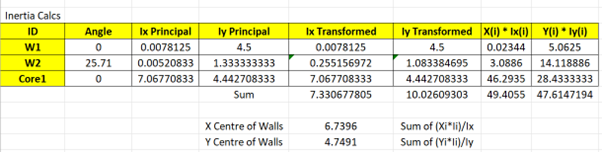
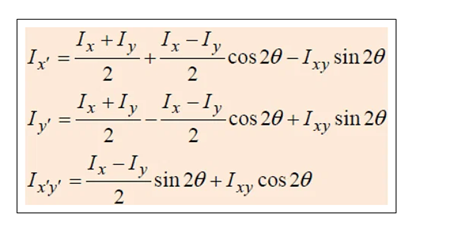
Note the transformed inertia formulae:
Compare with CentresKALC:
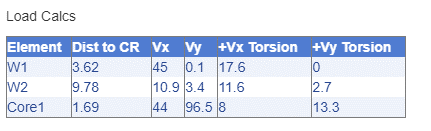
3. Shear Distribution from direct load (without torsional effects)
This is quite simple, each element will take according to its inertia weight:
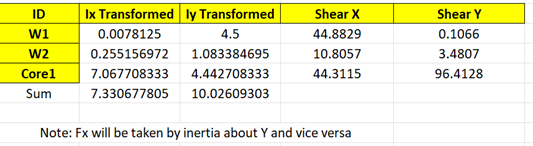
Compare with CentresKALC
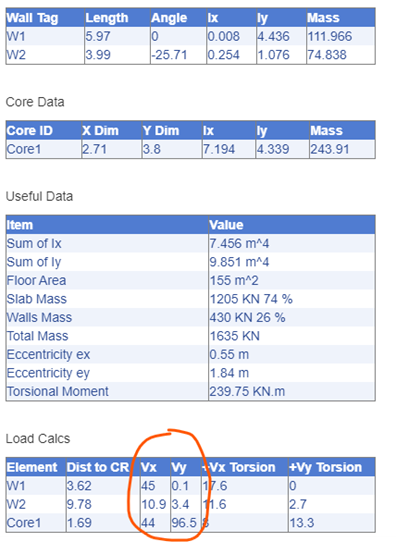
4. Shear Distribution from torsional moment
Total Torsional moment = Fx * ey + Fy * ex = 100 x 0.55 + 100*1.84 = 239
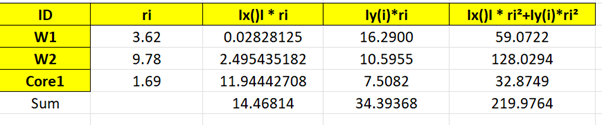
The formulae to calculate the additional shear from torsion is
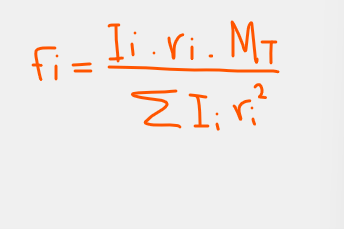
Where r is the wall distance to the centre of rigidity
Put things in tables:
And finally the loads become:
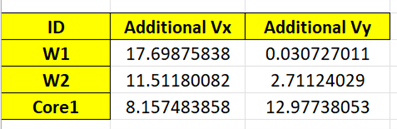
Compare:
Note here that the loads are always added to direct loads without torsion, since the horizontal loading will be applied in reverse direction as well. Click on the arrows icon to see the loads:
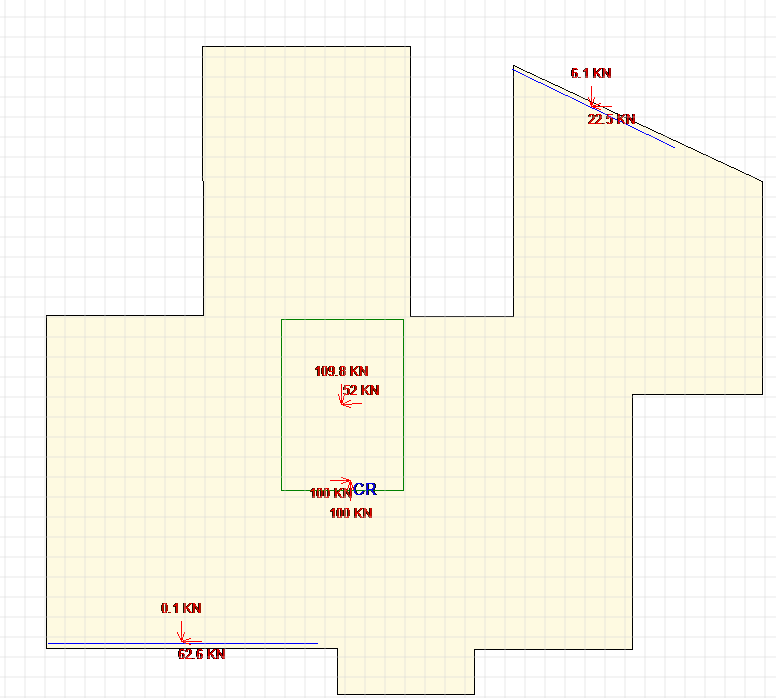
Finally, note that in case of inclined walls (not X or Y direction), the total shear vector is the sum of all of the loads, so in the above example the total shear applied to wall W
is 22.5 + 6.1 = 28.6 KN